
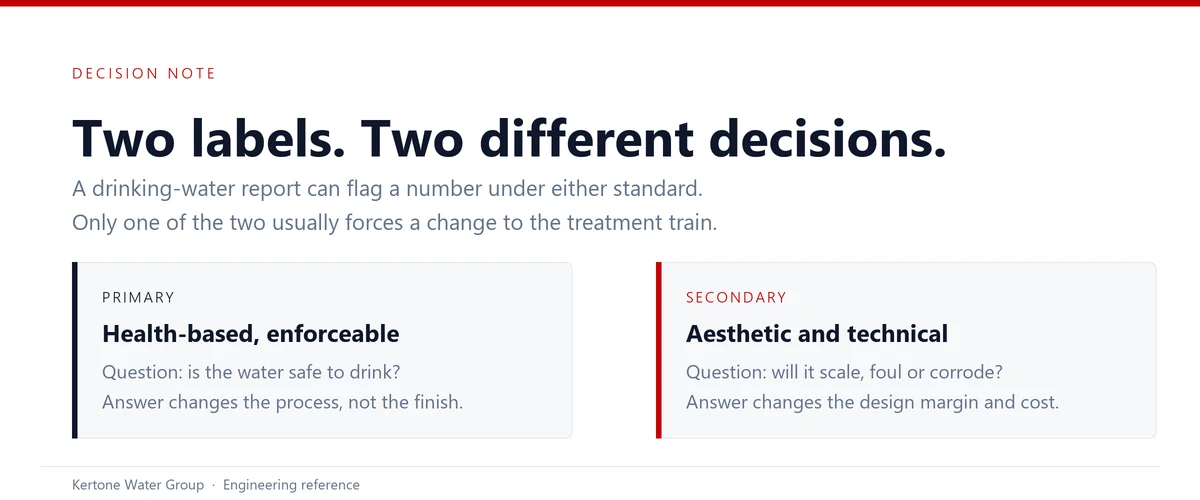
A water analysis usually arrives with a column of limits printed beside the results, and those limits are rarely labelled by origin. Some come from the National Primary Drinking Water Regulations, which the U.S. Environmental Protection Agency describes as mandatory standards for contaminants that present a risk to human health. Others come from the National Secondary Drinking Water Standards, a set of non-mandatory guidance values for 15 contaminants that EPA sets on aesthetic grounds (“Secondary Drinking Water Standards”).
The two lists answer different questions. The primary list asks whether the water is safe to drink. The secondary list asks whether the water will stain a fixture, taste salty, or scale a heat exchanger. For a building owner, that difference is administrative. For anyone sizing a treatment train, it decides which exceedances become process requirements and which become design margin.
1. Two labels, two different obligations
EPA separates the two sets deliberately. Primary standards are enforceable maximum contaminant levels, and they are written around health outcomes: arsenic at 0.010 mg/L, nitrate measured as nitrogen at 10 mg/L, fluoride at 4.0 mg/L (“National Primary Drinking Water Regulations”). Secondary standards are not enforced by EPA at all. They exist, in the agency’s own words, “to give public water systems some guidance on removing these chemicals to levels that are below what most people will find to be noticeable” (“Secondary Drinking Water Standards”).
The word “secondary” invites a dangerous shortcut. It is easy to read the label as “optional” and move on. Two details argue against that. First, EPA groups secondary effects into three categories — aesthetic, cosmetic and technical — and defines the technical category as “damage to water equipment or reduced effectiveness of treatment for other contaminants.” That is a capital-cost category, not a comfort category. Second, the boundary is not always soft: where fluoride falls between the 2.0 mg/L secondary level and the 4.0 mg/L primary level, a community system must still issue a public notice under 40 CFR 141.208.
The regulatory floor also moves. EPA states that from the Lead and Copper Rule Improvements compliance date of 1 November 2027, systems must meet a revised lead action level of 0.010 mg/L instead of 0.015 mg/L. A design frozen against an older limit can be non-compliant before it is five years old.
2. What the primary standards actually regulate
The primary table is short enough to read in full, and most of it is irrelevant to an industrial water system that never touches a potable tap. The rows that matter are the ones that survive contact with a process: the ions that pass a membrane, the metals that leach from pipework, and the disinfection by-products that form after chlorination.
| Contaminant | Federal limit | Type | What it forces in a design review |
|---|---|---|---|
| Arsenic | 0.010 mg/L | MCL | Anion exchange, adsorption media or RO; rarely removable by filtration alone |
| Nitrate (as N) | 10 mg/L | MCL | RO or anion exchange; a strong driver of concentrate volume |
| Nitrite (as N) | 1 mg/L | MCL | Usually treated together with nitrate |
| Fluoride | 4.0 mg/L | MCL | RO or activated alumina where natural fluoride is high |
| Lead | 0.015 mg/L action level (0.010 mg/L from 1 Nov 2027) | Treatment technique | Corrosion control first; removal at the point of use second |
| Copper | 1.3 mg/L action level | Treatment technique | Same corrosion-control decision as lead |
| Barium | 2 mg/L | MCL | Compliance is easy; barium sulfate scaling inside an RO is not |
| Selenium | 0.05 mg/L | MCL | RO or adsorption; check the concentrate side |
| Total coliforms | No more than 5.0% of monthly samples positive | MCL | Disinfection and distribution hygiene, not a treatment stage |
| Total trihalomethanes (TTHM) | 0.080 mg/L | MCL | Precursor removal before chlorination; carbon where needed |
| Haloacetic acids (HAA5) | 0.060 mg/L | MCL | Same precursor logic as TTHM |
Two entries in that table deserve a second look. Barium at 2 mg/L looks generous until the same water is concentrated fourfold inside a membrane array, at which point the barium sulfate saturation index, not the drinking-water limit, governs recovery. Lead and copper are listed as treatment techniques rather than concentration limits, which is EPA’s way of saying the number depends on the plumbing rather than on the source water.
3. What the secondary standards actually regulate
The secondary table is longer and, for plant design, more immediately useful. Every row describes a failure mode that shows up on a maintenance log: scale on a heat exchanger, rust in a storage tank, a salty taste in a product stream.
| Contaminant | Secondary level | Effect EPA lists | Design consequence |
|---|---|---|---|
| Total dissolved solids | 500 mg/L | Hardness, deposits, coloured water, staining, salty taste | Sets whether demineralisation is needed at all |
| Chloride | 250 mg/L | Salty taste | Chloride-to-sulfate ratio drives corrosion of stainless steel |
| Sulfate | 250 mg/L | Salty taste | Pairs with calcium and barium to form hard scale |
| Iron | 0.3 mg/L | Rusty colour, sediment, metallic taste, reddish or orange staining | Oxidation and filtration ahead of any membrane |
| Manganese | 0.05 mg/L | Black to brown colour, black staining, bitter metallic taste | Same stage as iron, but slower to oxidise |
| Aluminium | 0.05 to 0.2 mg/L | Coloured water | Often a coagulant residual, so fix the dosing, not the filter |
| Copper | 1.0 mg/L | Metallic taste, blue-green staining | Indicator of aggressive water; check pH and alkalinity |
| Zinc | 5 mg/L | Metallic taste | Galvanised pipe corrosion in older buildings |
| pH | 6.5 to 8.5 | Low pH: corrosion; high pH: deposits | The cheapest lever in the whole system |
| Silver | 0.1 mg/L | Skin discoloration | Relevant where silver is dosed as a biocide |
| Fluoride | 2.0 mg/L | Tooth discoloration | Public notice obligation between 2.0 and 4.0 mg/L |
| Foaming agents | 0.5 mg/L | Frothy, cloudy water; bitter taste | Surfactant breakthrough; carbon or source protection |
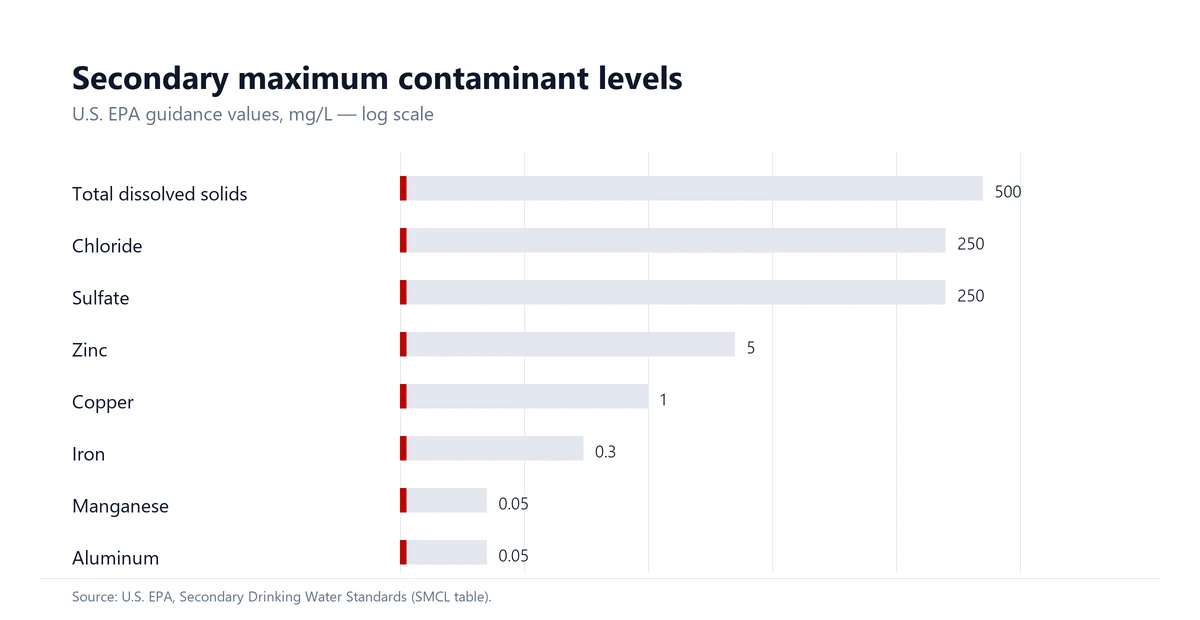
The range is the point. A single report can carry a chloride result 5,000 times the manganese result, and both can be exceedances. That is why a linear comparison of “how far over the limit” is misleading, and why the sensible question is not “which number is biggest” but “which mechanism does this number trigger.”
4. Where a secondary exceedance becomes a plant problem
Three mechanisms account for most of the damage, and they behave differently enough to need separate responses.
Scaling is a solubility problem. TDS, sulfate, and the hardness that EPA does not regulate at all combine to set the saturation state of the water. Raise the temperature or concentrate the stream, and the same water that passed a lab test begins to deposit calcium carbonate or calcium sulfate on the hottest surface available.
Corrosion is an electrochemical problem, and it is governed more by pH, alkalinity and the chloride-to-sulfate ratio than by any single metal concentration. A water that is comfortably inside every secondary limit can still perforate a mild-steel header if it is soft, low in alkalinity and high in chloride.
Fouling is a mass-transfer problem. Dissolved iron and manganese pass a 5-micron cartridge and then oxidise downstream, where the precipitate has nowhere to go. Aluminium behaves the same way when a coagulant is overdosed upstream. In each case the reported concentration understates the risk, because the damage happens after the water has been concentrated or aerated.
EPA’s own technical category names this clearly: damage to equipment and reduced effectiveness of treatment for other contaminants. A fouled carbon bed stops removing chlorine. A scaled membrane stops rejecting nitrate. The secondary exceedance becomes a primary failure.
5. From exceedance to unit operation
The mapping below is the practical output of the two tables. It assumes a municipal or well-water feed with no unusual industrial contamination, and it is ordered by the sequence water actually passes through.
| Signal in the report | Trigger | First unit operation | What drives the cost |
|---|---|---|---|
| Iron above 0.3 mg/L, manganese above 0.05 mg/L | Secondary | Oxidation followed by media filtration | Media volume, backwash water, oxidant dose |
| Hardness, no federal limit | Process requirement | Softening, or antiscalant with a recovery limit | Salt and regenerate volume, or chemicals and lower recovery |
| TDS above 500 mg/L, sulfate above 250 mg/L | Secondary | Reverse osmosis | Recovery, energy, concentrate disposal route |
| Aluminium above 0.05 to 0.2 mg/L | Secondary | Correct the coagulant dose upstream | Control instrumentation, not new vessels |
| pH outside 6.5 to 8.5 | Secondary | Chemical dosing and continuous measurement | Chemical storage, dosing pumps, analysers |
| Nitrate above 10 mg/L as N | Primary | RO, or anion exchange for low-salinity water | Brine or regenerant waste, and the disposal permit |
| Arsenic above 0.010 mg/L | Primary | Adsorption media or RO | Media replacement frequency, or concentrate handling |
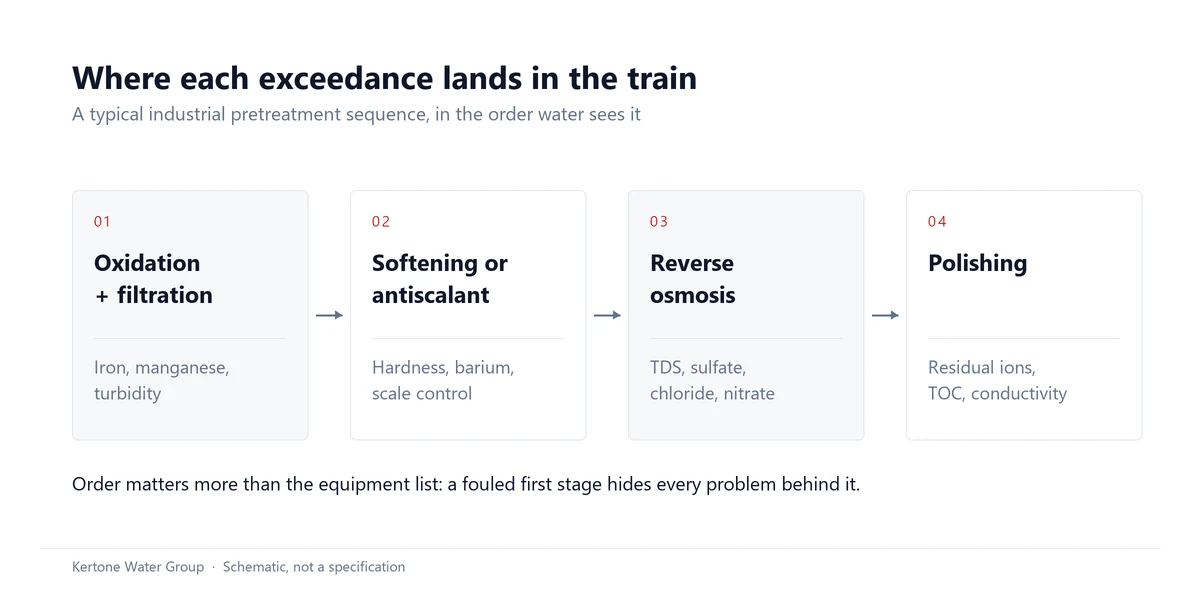
Two rules of thumb follow from the table. Put the cheap, high-volume removal first, because it protects everything downstream. And decide the concentrate route before you decide the membrane, because in most inland projects the disposal permit, not the skid, is the binding constraint.
6. A worked example: five exceedances, four decisions
The analysis below is illustrative, constructed to show the decision method rather than to describe any client’s water. It is a typical hard groundwater with elevated iron and manganese.
| Parameter | Reported | Limit | Standard | Verdict |
|---|---|---|---|---|
| Total dissolved solids | 1,180 mg/L | 500 mg/L | Secondary | Exceeds |
| Sulfate | 410 mg/L | 250 mg/L | Secondary | Exceeds |
| Chloride | 180 mg/L | 250 mg/L | Secondary | Within |
| Iron | 0.9 mg/L | 0.3 mg/L | Secondary | Exceeds |
| Manganese | 0.11 mg/L | 0.05 mg/L | Secondary | Exceeds |
| Hardness (as CaCO3) | 340 mg/L | No federal limit | Process | Design input |
| Nitrate (as N) | 3.2 mg/L | 10 mg/L | Primary | Within |
| Arsenic | 0.004 mg/L | 0.010 mg/L | Primary | Within |
| pH | 7.4 | 6.5 to 8.5 | Secondary | Within |
Four of the nine results sit inside their limits, and one parameter carries no federal limit at all. The four exceedances that matter, plus the one non-exceedance that still shapes the design, are decided as follows.
| Parameter | Decision | Why this order |
|---|---|---|
| Iron and manganese | Oxidation and filtration ahead of everything else | Both foul a membrane irreversibly once oxidised on its surface; removing them first protects the RO and the softener resin |
| Hardness | Softening, or antiscalant with recovery capped by the sulfate level | Not federally regulated, but it sets the scaling margin that the 410 mg/L sulfate has already reduced |
| TDS and sulfate | RO sized on the concentrate side, not the feed | At 1,180 mg/L feed, a 75% recovery design concentrates sulfate above 1,600 mg/L |
| Chloride | Monitor, do not treat | Within limit, but the chloride-to-sulfate ratio still governs alloy selection |
| Nitrate and arsenic | No dedicated stage | Both within primary limits; RO will remove them incidentally as a bonus |
Read together, the two tables give a design that a TDS-only review would have got wrong in two places: it would have under-sized the iron removal because 0.9 mg/L looks modest against a 500 mg/L TDS figure, and it would have set recovery from TDS alone while the sulfate set the real ceiling.
7. Where drinking-water compliance stops short
A treatment train that meets every federal drinking-water limit is not automatically fit for a hospital, a laboratory or a boiler house. Those applications carry their own specifications, written by their own standards bodies, and the gap between “potable” and “fit for purpose” is often one or two orders of magnitude in conductivity, silica or bacterial count.
Dialysis water, laboratory reagent water, boiler make-up and semiconductor rinse water each have a dedicated standard that names the analytical methods as well as the limits. The practical consequence is simple: drinking-water standards are the floor of the design, never the target. A specification that cites only the EPA tables has left the most expensive requirement unstated.
For medical and laboratory buildings, the water system usually serves several of these duty points from one central plant, which is why the distribution loop and the point-of-use polishing, not the RO skid alone, decide whether the installation passes commissioning. Our solutions pages set out how those duty points are typically separated.
8. What to hand your engineer
Most design errors traced back to a report are really information errors. The list below is what turns a lab sheet into a specification.
| Item | Why it changes the answer |
|---|---|
| Full report with detection limits | “Not detected” and “below 0.001 mg/L” are different design inputs |
| Sampling point and date | A sample taken after a softener describes the softener, not the source |
| Peak and average flow | Peak flow sizes the vessels; average flow sizes the operating cost |
| Feed-water temperature range | Membrane flux and silica solubility both move with temperature |
| The duty specification, not just the use | Potable, dialysis, reagent and boiler water have different limits |
| Discharge route and permit | Concentrate disposal often decides the achievable recovery |
| Existing pretreatment | Carbon, softener and storage all change what reaches the new plant |
With those seven items, the two standards tables in this article become a decision path rather than a compliance checklist. If you would rather have the concentrate-side calculations run against your own analysis, send the report to Kertone engineering. If the answer points to demineralisation, the C500 industrial RO series is the usual starting point for flows in that range.
References
U.S. Environmental Protection Agency. “National Primary Drinking Water Regulations.” EPA, www.epa.gov/ground-water-and-drinking-water/national-primary-drinking-water-regulations. Accessed 20 Oct. 2026.
U.S. Environmental Protection Agency. “Secondary Drinking Water Standards: Guidance for Nuisance Chemicals.” EPA, www.epa.gov/sdwa/secondary-drinking-water-standards-guidance-nuisance-chemicals. Accessed 20 Oct. 2026.